The Congrego® Dashboard is the landing page for users when they first sign in.
It provides a tailored way to view live data, manage processes (such as calibration control) and look at historical records.
Multiple dashboards
Congrego® allows for multiple dashboards, to view all available dashboards, press the dashboard button drop down arrow

Pressing drop down arrow
Once pressed, you can switch between existing dashboards
To add or remove dashboards, press the Edit Dashboards menu item
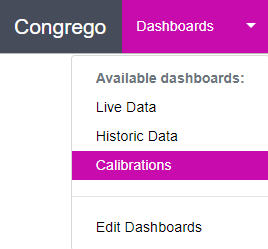
Viewing all current dashboards
Once Edit Dashboards is selected the following screen will allow you to add or remove dashboards.
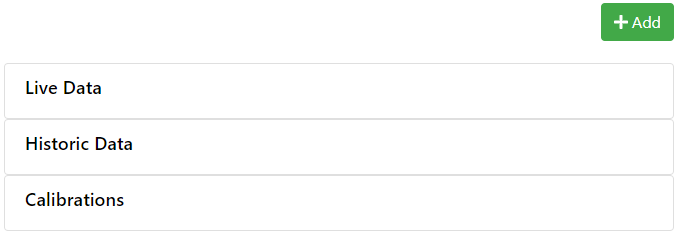
In order to edit or remove a dashboard, select a dashboard from the list.
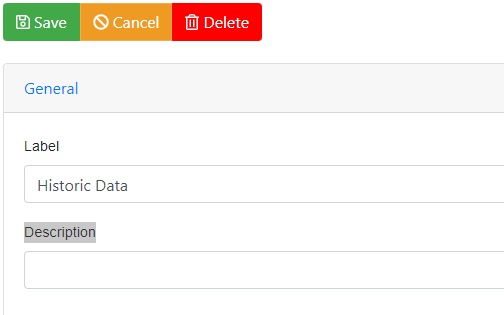
Editing an existing dashboard
The 'Live Data' dashboard can not be deleted. Multiple dashboards are allowed, there is no limit imposed on the number of dashboards that can be configured. |
If you want to add a dashboard, press the 'Add' button located on the top.
![]()
Enter a label fr the dashboard (which must be unique), save the new dashboard and then navigate to it and configure it with widgets.
Customising the dashboard
The dashboard uses an array of different “widgets” to define and control data views, each providing different formats and display options such as real-time graphs and calibration controls.
To begin customising your display scheme, scroll down to the bottom of the dashboard and select

Customise Dashboard Button
A gridded display will show, this is the dashboard setup page.
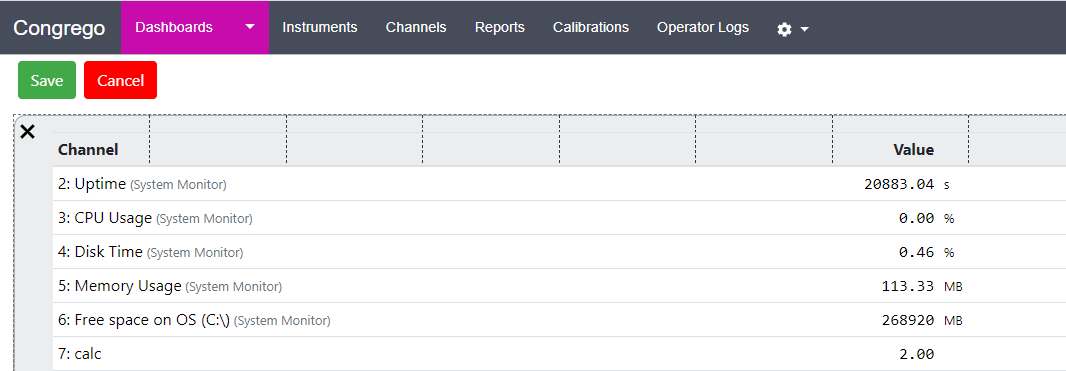
Edit Dashboard
From the setup page widgets are added and managed. To add a new widget, click on any part of the grid and the Add Widget option will appear.
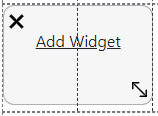
Add Widget
Click on the Add Widget text to open the widget selection menu and choose the desired data display type from the drop-down menu.
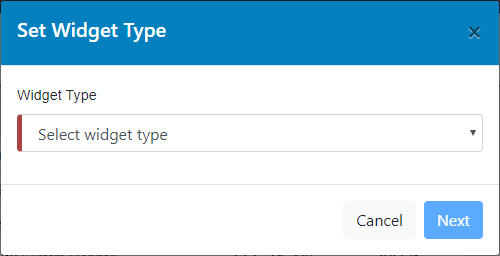
Select Widget Type
Follow the prompts to complete the setup and position and resize the data display as desired. Save the new dashboard setup when completed.
Widgets (data displays) can be moved, resized, edited or deleted at any time from the Dashboard Setup Menu (accessible via the Customise Dashboard button).
Dashboard Widgets
•Current Data Widget (All Channels)