Adding the Historical Data Table widget to the dashboard allows users to call up historical data for a selected period, based on the Report Data.
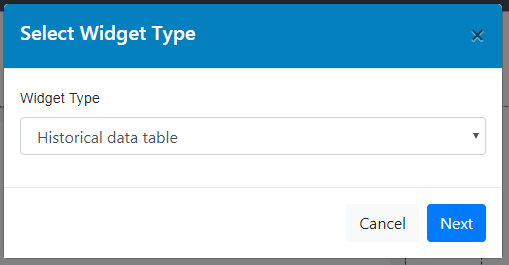
Select the widget type.

Historical Data Table
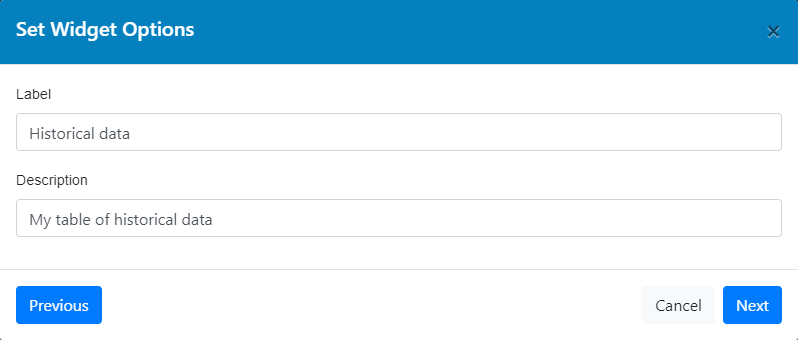
Add the widget details.

Historical Data Table Details
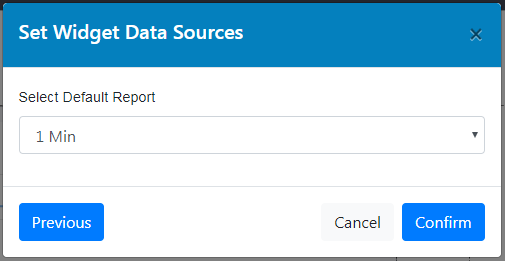
Select the report for the data.

Historical Data Report Selection
Check the preview and make any size or data source adjustments.
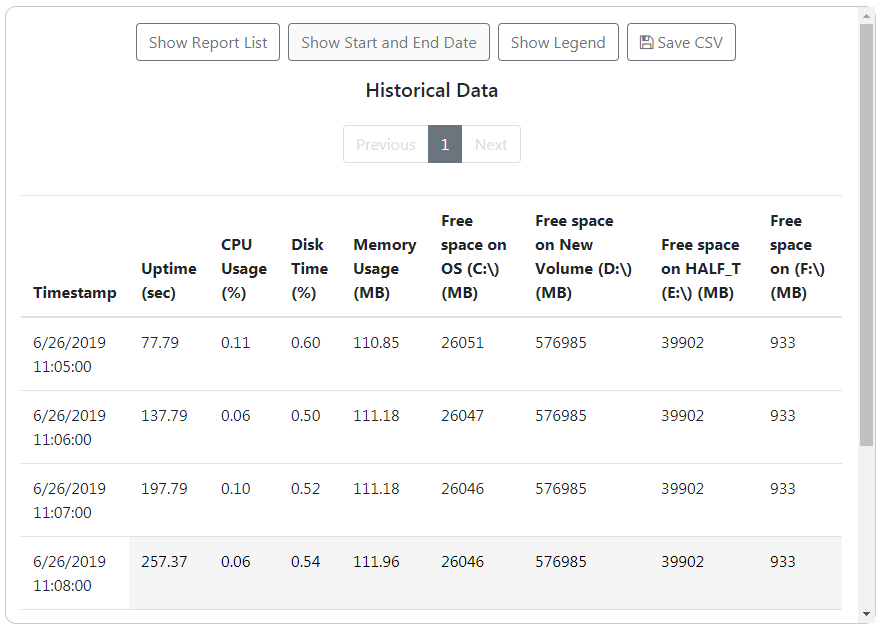
Save the widget and the Historical Data Table will be shown on the dashboard with all of the channels displayed.
The time/date range is defaulted to the current day.
Once added, the Historical Data Table is a permanent feature of the dashboard with settings that can be altered directly from the Dashboard view rather than the customized setup view.

Historical Data Table Widget
Adjustments can be made directly from the live dashboard by using the menu options.

Additional Menu Items
The page selection allows users to skip through the different pages of data displayed in the table.
Each page size is defined by the size of the widget on the dashboard and the amount of data to be displayed according to the start date and end date.

Page Selection
Show Report List displays a drop-down menu for users to select the source report to be used for the table.

Report Selection
Show Start and End Date allows users to choose the start date and end data for data to be displayed in the table, including the exact time in a 24 hour clock HH:MM:SS format.

Start and End Time Selection
Show Legend displays a table of the colours that are associated with each status flag.
The Historical Data Table displays data in different colours to denote different status flags.

Legend
Save CSV will automatically download a CSV (comma-separated values) file of the data currently displayed in the Historical Data Table widget to the local machine.
This file can then be opened with programs like Microsoft Excel and alternatives.