Adding the Historical Line Chart widget to the dashboard allows users to produce a historical data plot for a selected period, based on the Report Data.
Select the widget type.

Historical Data Line Chart
Add the widget details.
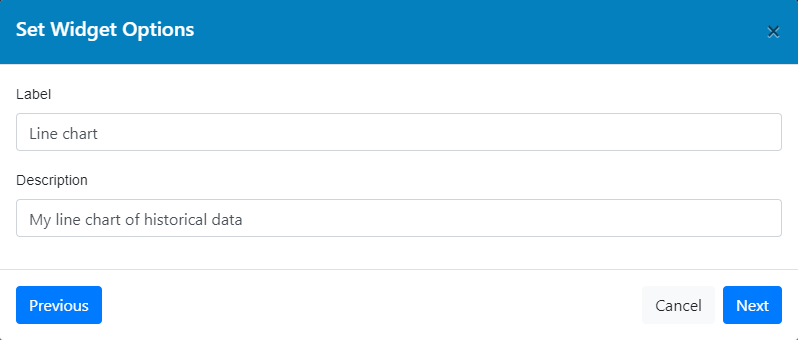
Widget Details
Select the source report for the data.
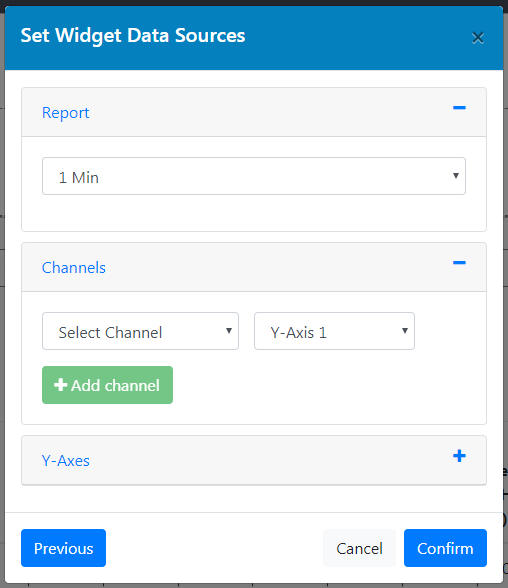
Historical Data Line Chart Source Selection
Select the parameter(s) to be plotted. A maximum of six can be selected.
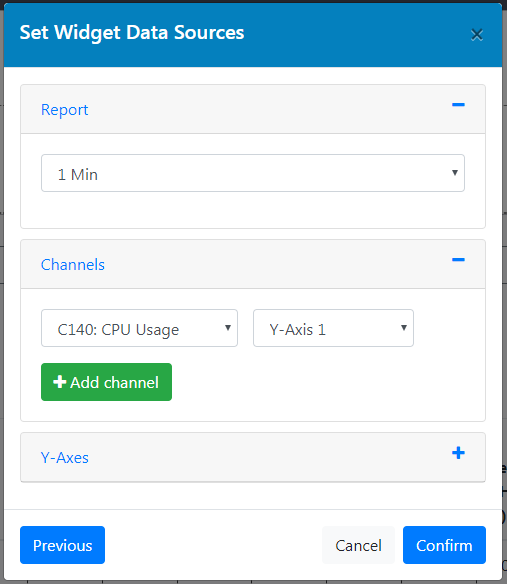
Historical Data Line Chart Parameter Selection
Add ranges to the axis settings if needed, otherwise leave the fields empty for automatic settings.
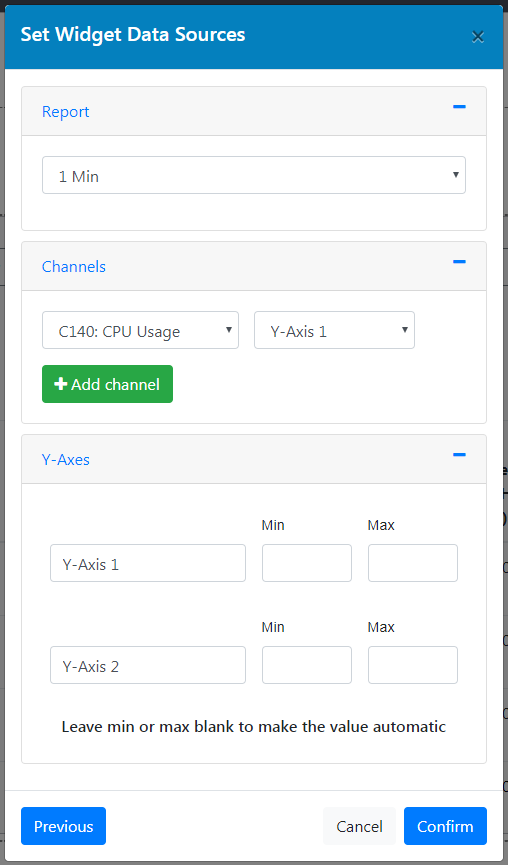
Historical Data Line Chart Axis Settings
Check the outlined box and make any size or data source adjustments.
Save the widget and the Historical Data Line Chart will be shown on the dashboard with the selected channels displayed.
The time/date range is defaulted to the current day.
Once added, the Historical Line Chart is a permanent feature of the dashboard with settings that can be altered directly from the Dashboard view rather than the customised setup view.
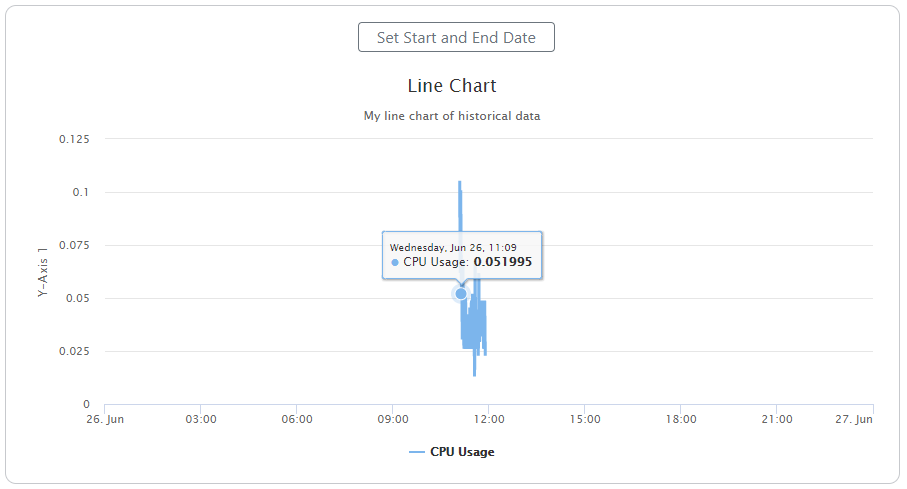
Historical Data Line Chart Widget
Adjustments can be made directly from the live dashboard by using the menu options.
Show Start and End Date allows users to choose the start date and end data for data to be displayed in the table, including the exact time in a 24 hour clock HH:MM:SS format.

Start and End Date Selection
When data is displayed in the graph, users can move the mouse pointer over the data to see specific values for specific channels.
The data is highlighted and the channel information, result, time and date are displayed.
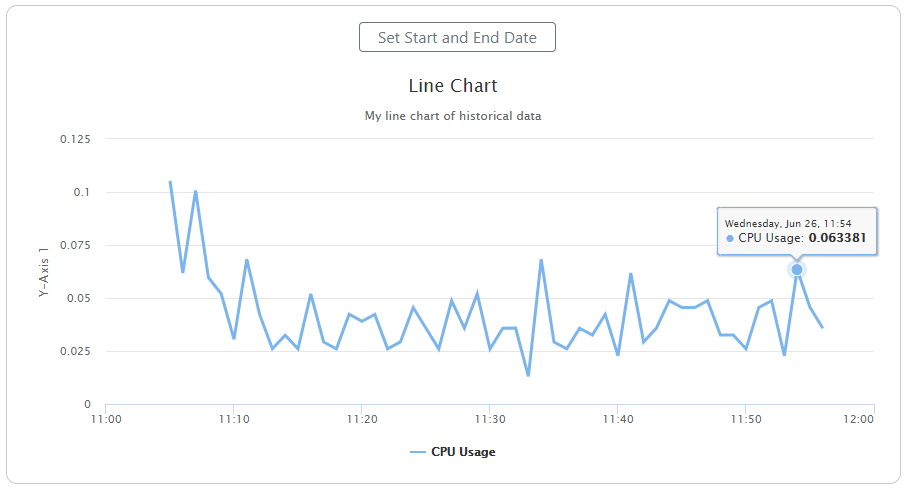
Historical Data Line Chart Showing One Hours Data